Aftermarket demand has risen 254% since 2010, and will remain strong through 2021
It comes as no surprise that emission-related components are the fastest-growing component in the aftermarket. The aftermarket demand has increased 254% since 2010. And by 2021, demand will increase another 42%.
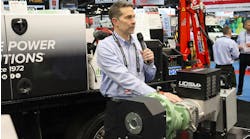
That’s one of the key takeaways from “Structure and Trends of the Current Heavy Duty Aftermarket,” presented by John Blodgett, VP of sales and marketing for MacKay & Company, and Dave Kalvelage, manager of IT and database services.
Other examples of how dramatically the aftermarket landscape is changing:
• There is a shift to aluminum radiators, impacting serviceability and the business impact on smaller repair shops.
• There is a shift from cleaning DPF filters locally to the use of factory-remanufactured product.
• There is a shift from remanufactured to new products for starter and alternator replacement from offshore manufacturers, mainly due to price equality.
Blodgett said MacKay’s current forecast is for the United States aftermarket to be up 1.5% in 2017, based on the tracking of 670 components, broken down by category.
“That’s a combination of the population being up and a little bit of an impact from the change in replacement types,” Blodgett said. “So if somebody tells us they’re using remanufactured widgets and are switching to new widgets, that doesn’t change the demand in units but changes the price a bit. The age and condition of vehicles can have an impact. That has a little bit of a negative in the forecast for 2017. We expect utilization to be up 2%. We’re using a 1% price increase for next year and a 1.5% total year-over-year change.”
Canada is forecasted to be up 7.2%, primarily driven by a 4.2% price increase.
“We get feedback from distributors in Canada about how much more they are paying for parts,” Blodgett said. “They’re also having the age distribution impact of the operating population.”
John Blodgett, MacKay
The US aftermarket should be a $30.61 billion market this year, increasing every year to $34.6 billion in 2021.
“It does include a 1% price increase,” Blodgett said. “Somebody mentioned to me last night that everybody’s trying to sell more products at higher margins. Well, it’s not really going to come from a larger aftermarket. It’s going to come from taking a larger share from competitors or getting into product categories you’re not currently in. It’s a fairly mature market both in the US and Canada.”
All product categories will be up 2% or higher for 2017, led by power transmissions (2.6%), cab/chassis (2.1%), and electrical (2%).
The Canadian aftermarket is forecasted to be $4.9 billion in 2017, increasing steadily every year to $6 billion in 2021.
Kalvelage discussed some factors impacting the aftermarket:
• Retail sales.
Class 6-7 sales in the United States in 2016 came in 9.8% above the forecast by FTR and Ward’s (120,800, compared to 110,000). Class 8 sales were down 10.7% (193,000, compared to 215,000), and trailers were up 0.5% (280,100, compared to 278,700).
“Initially, there is not a huge impact,” he said. “Filters and parts that were replaced quickly will start to impact the aftermarket, but it’s generally when those retail populations move on down the line to get three, four, five, six years old … that’s when they start to impact the parts market.”
• Truck brand retail share.
In Class 8 in 2010, International had a 25% share, but that had fallen to 13% by 2015. Freightliner picked up 6% of that to improve to 38%, Paccar picked up 5% to get a 28% share, and Mack Volvo picked up 2% for a 20% share.
“Even in that short time, there have been big changes in the industry,” he said.
• Engine brand retail sales.
“In Class 8, there was a change in truck manufacturing using more of proprietary engines,” he said. “Cat was still a player in 2010 at 4%, and now it’s gone. Cummins lost 2%, but growth was really seen in Detroit Diesel (29% share, up from 24%), Volvo (11%, up from 6%), and PACCAR (11%, from 2%).
• US operating population.
In 2016, there were 9,228,500 vehicles: Class 8, 2,902,700 vehicles, up 0.3%; trailers/container chassis, 4,856,200, up 1.7%; and Class 6-7 vehicles, 1,469,600 vehicles, down 0.8%.
• Canadian operating population.
In 2016, there were 1,113,300 vehicles: Class 8, 346,600, down 1%; trailers/container chassis, 575,900, up 0.4%; and Class 6-7, 190,900, down 2%.
“In Class 8, agriculture accounts for 17%, compared to 8% in the US,” he said. “In Class 6-7, agriculture is 33%, compared to 10% in the US.”
• Mexican operating population.
In 2015, there were 784,000 vehicles: heavy duty, 453,000; trailer/container chassis, 241,000; and Class 6-7, 90,000.
• US total power/Class 6-8 utilization.
It was 82.6% for all of 2016, boosted by 83.4% in the final quarter—compared to the Fleet Forecast of 85.5%.
“We survey fleets on a quarterly basis, getting back 700-900 responses,” he said. “We use utilization in our models. If utilization is up, that will increase the overall parts demand.”
• Parts prices.
They have gone up 1.1% and 1% in the past two years, below the average of 2% since 1989.
• Truckable Economic Activity (TEA) and enhanced aggregate spread.
“How does the economy affect the parts market? TEA in 2016 averaged 1.5% growth. It’s still growing, but at a slower rate. This was the slowest rate since the Great Recession.”
Blodgett said the component manufacturers’ Aftermarket Index showed year-over-year declines in the US for OEMs (5.9%) and independents (5.3%) for a total decline of 5.6%. Canada showed a 4.1% decline, with OEMs down 14.8% and independents up 3.1%. In Mexico, there was a 0.1% decline, with OEMs up 0.3% and independents down 0.4%.
“We don’t get the rationale for these indexes, but I think the exchange rate had a bit to do with Canada’s change,” he said. “Mexico is typically very volatile, but last year we didn’t see lot of volatility.
“We have 20 companies, and they represent 10% of the total aftermarket, but we don’t know if it’s a reflection of the market being down or some of the players in this index losing share. These 20 companies don’t have the portfolio or spread we have in our DataMac, so it’s not exactly apples against apples, but it is a resource for us.”
In parts sales, truck dealers were down 1.5% for 2016 and HD distributors were flat after being down 4.5% in the first six months of the year.
MacKay & Company’s Heavy Duty Independent Distributors Index was down 1.8% year-to-date in the third quarter, while the OE Truck Manufacturer Parts Tracker was estimated to be down 2% to 3% year-over-year.
In US model segment impacts, the index was down 1.5% in 2016 compared to a forecasted gain of 0.8%. The price was up 1%, compared to a forecast of 2%. Utilization was down 0.9%.
In Canada, the estimated 7.9% gain ended up being 7.4%. A big driver of that was price, which had a gain of 3.7%, albeit 0.6% less than the forecast.
Dave Kalvelage, MacKay
Kalvelage said US replacement demand for Class 6-8, trailers, and chassis is $30.2 billion. Class 8 is 70% of that parts demand. By vocation, private (20%) and for-hire carrier (31%) represent half of the parts market.
Who’s doing the service work? 67% of fleets do their own service work, followed by OE dealers (16%), independent garage (9%), engine distributors (3%), rebuilders (3%), and all others (2%).
Where are parts being purchased? OE dealers account for 49%, followed by HD distributors (18%), independent garages (9%), engine distributors (8%), auto parts (4%) and others (6%).
In point-of-service by ownership, he said fleets are still pretty much the same, doing 68% of the service work in first owners and 67% in subsequent owners.
“But for the first owner, the dealer has an 18% share and when it gets to the second owner, they lose 4%, to 14%,” he said. “For independent garages, it’s a 5% share of the first owner, but subsequent owners are getting 14%, up 9%.”
He said MacKay surveyed fleets, asking them if they are going to outsource service work, and how far they are willing to travel. For paint and body work, fleets are willing to travel 40 minutes; for an engine overhaul, 46 minutes.
“The main point is that if fleets are going to outsource work, they’re only going to do it in the local area,” he said. “They’re not going to go beyond 45 minutes to one hour.”
The top concerns about outsourcing power unit service work: time lost/downtime/turnaround drew 36% in 2015, up from 24% in 2011; cost of repairs drew 25%, down from 26% in 2011; and quality of work/repair drew 23%, down from 26% in 2011.
“They don’t want their vehicle sitting around, and they really emphasized that in the last service study,” he said.
Added Blodgett, “Consistently for the last several studies, those numbers had all been fairly equal, but in this last study, down time really jumped ahead of others.”
Talking about the channel of distribution by owner in the US for Class 6-8 and trailers/chassis, Kalvelage said OE dealers are getting 53% of the market for the first owner, but that drops to 43% for subsequent owners. HD distributors go up 3%, to 20%, for subsequent owners. Independent garages gain 9%, to 14%.
The US replacement demand market has not changed much over the last few years. New parts are up 2%, to 77%.
“There are parts you have the option to buy something other than new,” he said. “If you’re talking about a remanufactured alternator or starter, they have the option to buy something other than new, but we’re seeing a trend of buying more new parts.”
Blodgett talked about the Canadian market, saying it’s $4.6 billion, with Class 8 making up a higher percentage than we see in the US (74% to 70%), and medium-duty accounting for 19% and trailers 7%.
“Agriculture is a lot more important on a percentage basis (17% to 5%),” he said. “For-hire carriers and private fleets are still strong, but not as large of a percentage as we see in the US.”
About two-thirds of the service work is done by fleets in the US, but just 58% in Canada, “so that means more service work is outsourced by fleets, and that means more opportunities for service providers. OE dealers get 21% and independent garages get 14% in Canada.”
Where are parts purchased? Similar to the US, dealers get 50% of the business, followed by HD independent parts distributors (17%) and independent garages (14%).
The used market is important, driving half of the aftermarket, similar to the US: $2.4 billion for the first owner and $2.2 billion for subsequent owners.
“There is more difference in Canada than in the US: Used owners of vehicles do more service work than first owners,” he said. “There is increased use of independent garages and less use of OE dealers with used owners of trucks. First owners are a little bit closer to the OE distribution channel.”
Where are parts purchased? For first owners of vehicles, almost 60% of what they buy goes through OE dealers. HD distributors get 14% and independent garages 10%, but the OE dealers still get the largest chunk (59%). But that goes down to 41% with second owners.
He said the Mexico statistics include both intercity and intracity buses. In the $3.4 billion market, Class 8 drives about 60% of aftermarket demand and medium-duty 15%, transit buses 13%, coach buses 8%, and trailers 4%. By vocation, for-hire is 37%, industry/commerce 29%, and buses 21%.
“The OE dealer has a smaller slice for this market,” he said. “It’s really a dynamic market. If you look at the total aftermarket, OE dealers get 15% of the market where parts are sold. HD independent parts distributors don’t have huge networks like they have here, but they get 30%. Independent garages get 32%. That is a big slice of the pie, but in Mexico, quite often the independent service provider is provided the parts by the owner of the vehicle, so they’re not always making the decision of going out and buying the parts.”
Kalvelage said the Class 8 truck market in the US was down 23% in 2016 to 193,000 units. The forecast is for another 15% drop in 2017 to 165,000, then a rebound in 2018 to 213,000. Trailers are forecast to follow the same pattern, falling 13% in 2017 to 244,000, then increasing 9% in 2018 to 265,000. ♦
