Truck sales in the United States face a “very positive forecast going forward,” according to Steve Latin-Kasper, the National Truck Equipment Association’s director of market data and research.
In his recent webinar, “Mid-Year Update on Work Truck Industry Market Activity,” Latin-Kasper said the IHS Automotive forecast became much more negative for 2016 in its July update as opposed to December 2015, but he believes IHS “probably overstated that as a reaction to very bad first quarter US GDP numbers.”
“NTEA’s data is indicating that Class 4-6 are still well up through May, averaging 18% growth in Class 4-6 and 8% in Class 7,” he said. “Class 3 is flat for the year and Class 2 and Class 8 are down through May. So this updated IHS forecast getting as negative as it did for 2016 may be off the mark. Based on IHS’ July forecast update for Class 3-8 for 2016, they’re now calling for a 7% decline this year compared to 2015. But if you just look at 3-7, it’s a 1.4% decline, and if you just look at 4-7, it’s 3.6% growth in 2016 over 2015.
“The good news is that the 2017 forecast is much improved compared to the December 2015 forecast put out by IHS, and they aren’t calling for an actual decline in total Class 3-8 sales again until 2020. So a very positive forecast going forward.”
He said the growth numbers for Canada going forward are better than the US for all of the years though 2020, and Mexico’s forecast is even better than Canada’s.
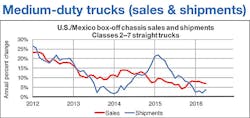
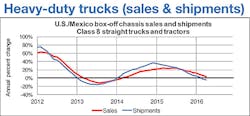
He said NAFTA’s commercial truck chassis market velocity consistently declined throughout most of 2015 and into the first part of 2016 because shipments fell, sales got way ahead of shipments, inventories were drawn down, and lead times increased.
“But expectations bounced up again as a sales increase persisted through the first quarter and into the second quarter of 2016,” he said. “It flattened in May, but will probably continue moving slowly up in the second half of 2016, if current sales levels hold, which is what we expect.”
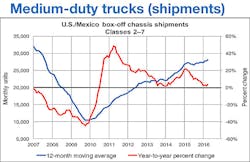
Latin-Kasper spent some time discussing the dynamics of the truck market over the past few years. He said US/Mexico box-off chassis shipments (Class 2–7) slowed down in the middle of 2015, but started increasing again to start 2016.
“We can think of shipments as being heavily influenced by OEM expectations of future sales,” he said. “Their expectations got very high at the end of 2014—in fact, too high. Those came down along with the growth rate for sales in 2015, then got too low at the beginning of 2016. And now, instead of having an inventory build as we had in 2015, we have an inventory getting drawn down, which means lead times have been extending in Class 2-7 generally. It’s a very different experience in each of the individual classes. For the moment, shipments got well below sales as we came out of 2015 into this year, and hopefully expectations are improving. It looks like they were at the end of the second quarter, and we’ll see improvement in lead times in the second half.”
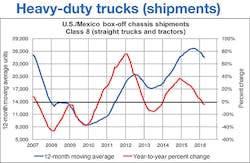
It has been a different story for Class 8 straight trucks and tractors.
“We had a large inventory gap open up,” he said. “It peaked at the end of 2015, started coming down, and continued down in the first quarter of this year. It turned into a rate of growth that went negative. We expect that to continue going down. This includes straight trucks and tractors. There is more of a problem in the tractor segment than straight truck, but sales are actually going down in both segments of Class 8.”
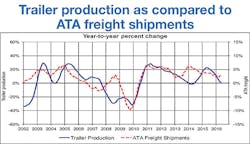
He said that he measures trailer production as compared to American Trucking Associations (ATA) freight shipments because it’s not only a good leading indicator of trailer production, but a good indicator of work truck activity in general.
“The rate of growth in the ATA index peaked in the current cycle at the beginning of 2014, but was sliding down and then stabilizing in 2015,” he said. “And in the second quarter of 2016, it turned up again, indicating more economic activity generally speaking, not just in our industry but in the US economy as we head into the second half of 2016.”
Other leading indicators:
• Housing starts as compared to business truck production.
“Over a long period of time, housing starts and the business truck index have been highly correlated. At the end of 2012 and beginning of 2013, the growth rate peaked about two years after business truck production peaked. The rate of both forecasted going forward was relatively flat. Housing starts are predicted to grow at a rate of 11-12% through the rest of this year and continue at that rate in 2017. With business truck production, some are forecasting it to go down in the second half of 2016. But overall, the forecast going forward has growth continuing through the second half of 2016 and into 2017.”
• Prime rate and heavy-duty truck production.
“The prime rate inverted and heavy-duty truck production year-to-year percent change prime rate has peaked and led by two to three years. There was a bump in the rate in 2015, and we’re expecting at least one more bump this year, maybe two. The forecast is for the prime rate of interest going down. There are intersections at the end of 2012, and the end of 2014, and the beginning of 2015, and again early in 2016. This is saying we’re likely to reach a trough in the heavy-duty series in 2017 before it gets to the end of this current cycle and comes back down to intersect with the prime rate in 2018 through 2020.”
• COLAG as compared to medium-duty truck production.
“It is a very good, consistent leading indicator of medium-duty right up to the last recession. COLAG as an indicator of medium duty ended up being badly distorted as a result of labor and financial market distortion, which still hasn’t rebounded and isn’t behaving normally. It’s not acting as good of a leading indicator as it used to. It’s not saying the medium-duty rate of growth is likely to peak in the very near future and start heading back down in 2017 and 2018. It’s not calling for a downturn in medium-duty sales. It’s calling for a decline in the rate of growth. We expect growth in medium duty to continue in the second half of this year and into 2017. It had been growing at a very high rate in the first and second quarters, and we’re expecting that to decline a little bit in the next six to 12 months.”
• Yield curve: 10-year T-bill minus two-year T-bill.
“As much talk of a recession as there has been, we are not likely to see a recession in the US economy or work truck industry as a whole until we see the yield curve fall below zero again. That’s essentially the 10-year T-bill rate minus two-year T-bill rate. We’re a ways away from that. Part of what’s going on with the downturn in the yield curve is the result of financial uncertainty. The last little dip down had something to do with Brexit and the continuation of the Federal Reserve to keep interest rates low. Brexit led the rest of world to throwing money at US T-bills again, which pushed rates for two- and 10-year T-bills down. So we’re waiting for some sort of global financial stability to see where the two- and 10-year rates are really going to end up at the end of the year. It’s very hard to make a call on them right now. It’s just as likely that the yield curve will turn up a bit as it is to go down, if we can get some financial sectors stability. Brexit turned out to be not nearly as big of a deal for the rest of the world as the financial world was thinking it would be. Stock markets picked up again within two to three days after the vote in Great Britain, and we expect to see this stabilize a little bit, not to continue to go down at the rate it has been since the end of 2013 and beginning of 2014. The yield curve won’t get to zero this year. If it happens in 2018, that will align the recession at 2019 at the earliest.”
Here’s Latin-Kasper’s take on other economic measurements:
• US real gross domestic product (GDP).
“Growth peaked in 2014 in terms of US economic activity. We reached 5% for a brief moment in time in the third quarter, and then the growth rate started sliding down again. The forecast going forward doesn’t show the bumpiness we’ve seen over the last three or four years. They’re calling for it to be flat. Kind of boring, but the point is to get the direction cleared, not to get the ups and downs from one quarter to the next. The National Forecast for Business Economics (NABE) is saying they expect more growth—anywhere between 2% and 2.5% for the rest of the year and through 2017. So where is all the talk of bad economic activity coming from, especially out of various media channels? A lot of that has to do with labor market activity over the course of the last few months.”
• Employment, hours, and earnings from the current employment statistics survey.
“It shows the net monthly change in non-farm employment going back to ‘99. Coming out of the recession in 2001, there was a big bounce in monthly employment, and it eventually got to the point where it peaked in the end of 2005 and started heading down again to the big recession of 2007-2009. It bounced out and got to a peak at the end of 2014, and things started sliding down. From 2010 to the end of 2015, you had 12.3 million jobs created by the US economy. We got to the point where all of you were starting to scrape the bottom of the labor market barrel in the second half of 2015 and the first half of 2016. We had a bad number in April with only a 38,000 net change in jobs. That’s a very low number. Everybody freaked out and there were bad reports in the media. Well, it bounced back in May with an increase of 287,000 jobs net change. And that was only a story for about five minutes. So once the recession scare that was brought on by one bad month of data was gone, the media stopped talking about a recession again. I’m sure if we get to another monthly data point with low job creation, the media will start up the recession talk all over again. But there really isn’t any need to start worrying about recession any time soon.”
• NABE outlook.
“For most macro indicators, the members of the forecast panel became more negative about growth this year as of June than they were back in December. The GDP forecast fell from 2.6% to 2.3%, personal consumption expenditures fell from 3% to 2.5%, business fixed investment from 4.7% to 3.6%, residential investment from 8.4% to 7.4%, while government spending/investment stayed at 1.2%. Residential was almost 4 points higher in both of the outlooks, December and June. Good growth is still expected, but not pulling GDP up to as large as an extent as it might have in past cycles because the Federal Government is still expected to be flat or down for the rest of 2016 compared to 2015.
“Non-farm business compensation is the only one expected to go up. We’re now scraping the bottom of the labor market barrel. You guys and companies in other industries all over the US economy are hiring people away from each other, and that’s usually an indicator of good economic activity not translating into huge growth numbers in GDP. As wage rates continue to go up, we expect that to accelerate, not decelerate. The current forecast is for 3% wage growth in 2016 compared to 2.8% in December 2015. That might get higher. It’s not likely to get lower, and it will probably be better in 2017 than it‘s expected to be in 2016, as more people decide to change companies.”
• Producer price indexes.
“In the steel industry, prices have been siding downhill since 2011 for hot- and cold-rolled sheet and strip and hot-rolled plate and bar, but in all three cases, they started turning up at the end of the first quarter and went up in the second quarter. In the second half of this year, the expectation here would be for a continuation in the increase of steel prices, although no one is expecting steel prices to spike in the second half of 2016. We expect the rise of steel prices to remain manageable. They might get out of hand, but that’s unlikely because global growth remains slow and the steel industry capacity on a global basis is still very high. It’s underutilized. What really caused the price increase in the last three to four months was inventory imbalance, with China not stocking up the way it normally would have at the end of the year. There was a bit of a rush to get more steel, especially in China. And that is affecting global prices at the moment. As that tapers off over the next few months, we expect the rate of growth in steel prices to taper off, but not to stop. We expect them to continue growing, just not as fast as they did in the last three or four months.
“Aluminum sheet and scrap prices jumped at the beginning of 2016, primarily for the same reason as they went up in the steel market. But growth in India and the rest of the globe—US, South America, and the rest of North America—is looking good, except for Brazil. Oil countries have come back around, and demand for commodities in general is looking like it will continue going up, but slowly. We do expect prices to keep rising, but at a manageable rate.”


